x
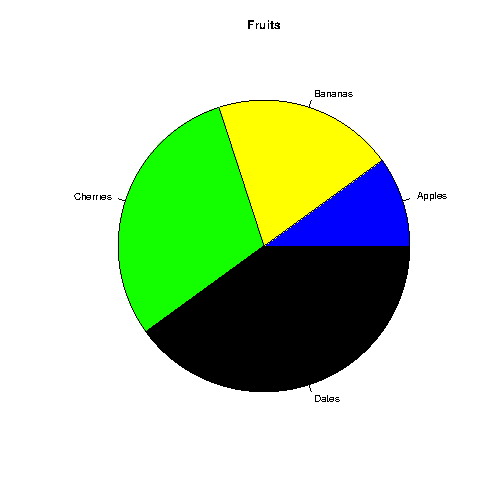
# We need this line of code to show graphs in our compilerbitmap(file="out.png")# Create a vector of piesx <- c(10,20,30,40)# Create a vector of labelsmylabel <- c("Apples", "Bananas", "Cherries", "Dates")# Create a vector of colorscolors <- c("blue", "yellow", "green", "black")# Display the pie chartpie(x, label = mylabel, main = "Fruits", col = colors)